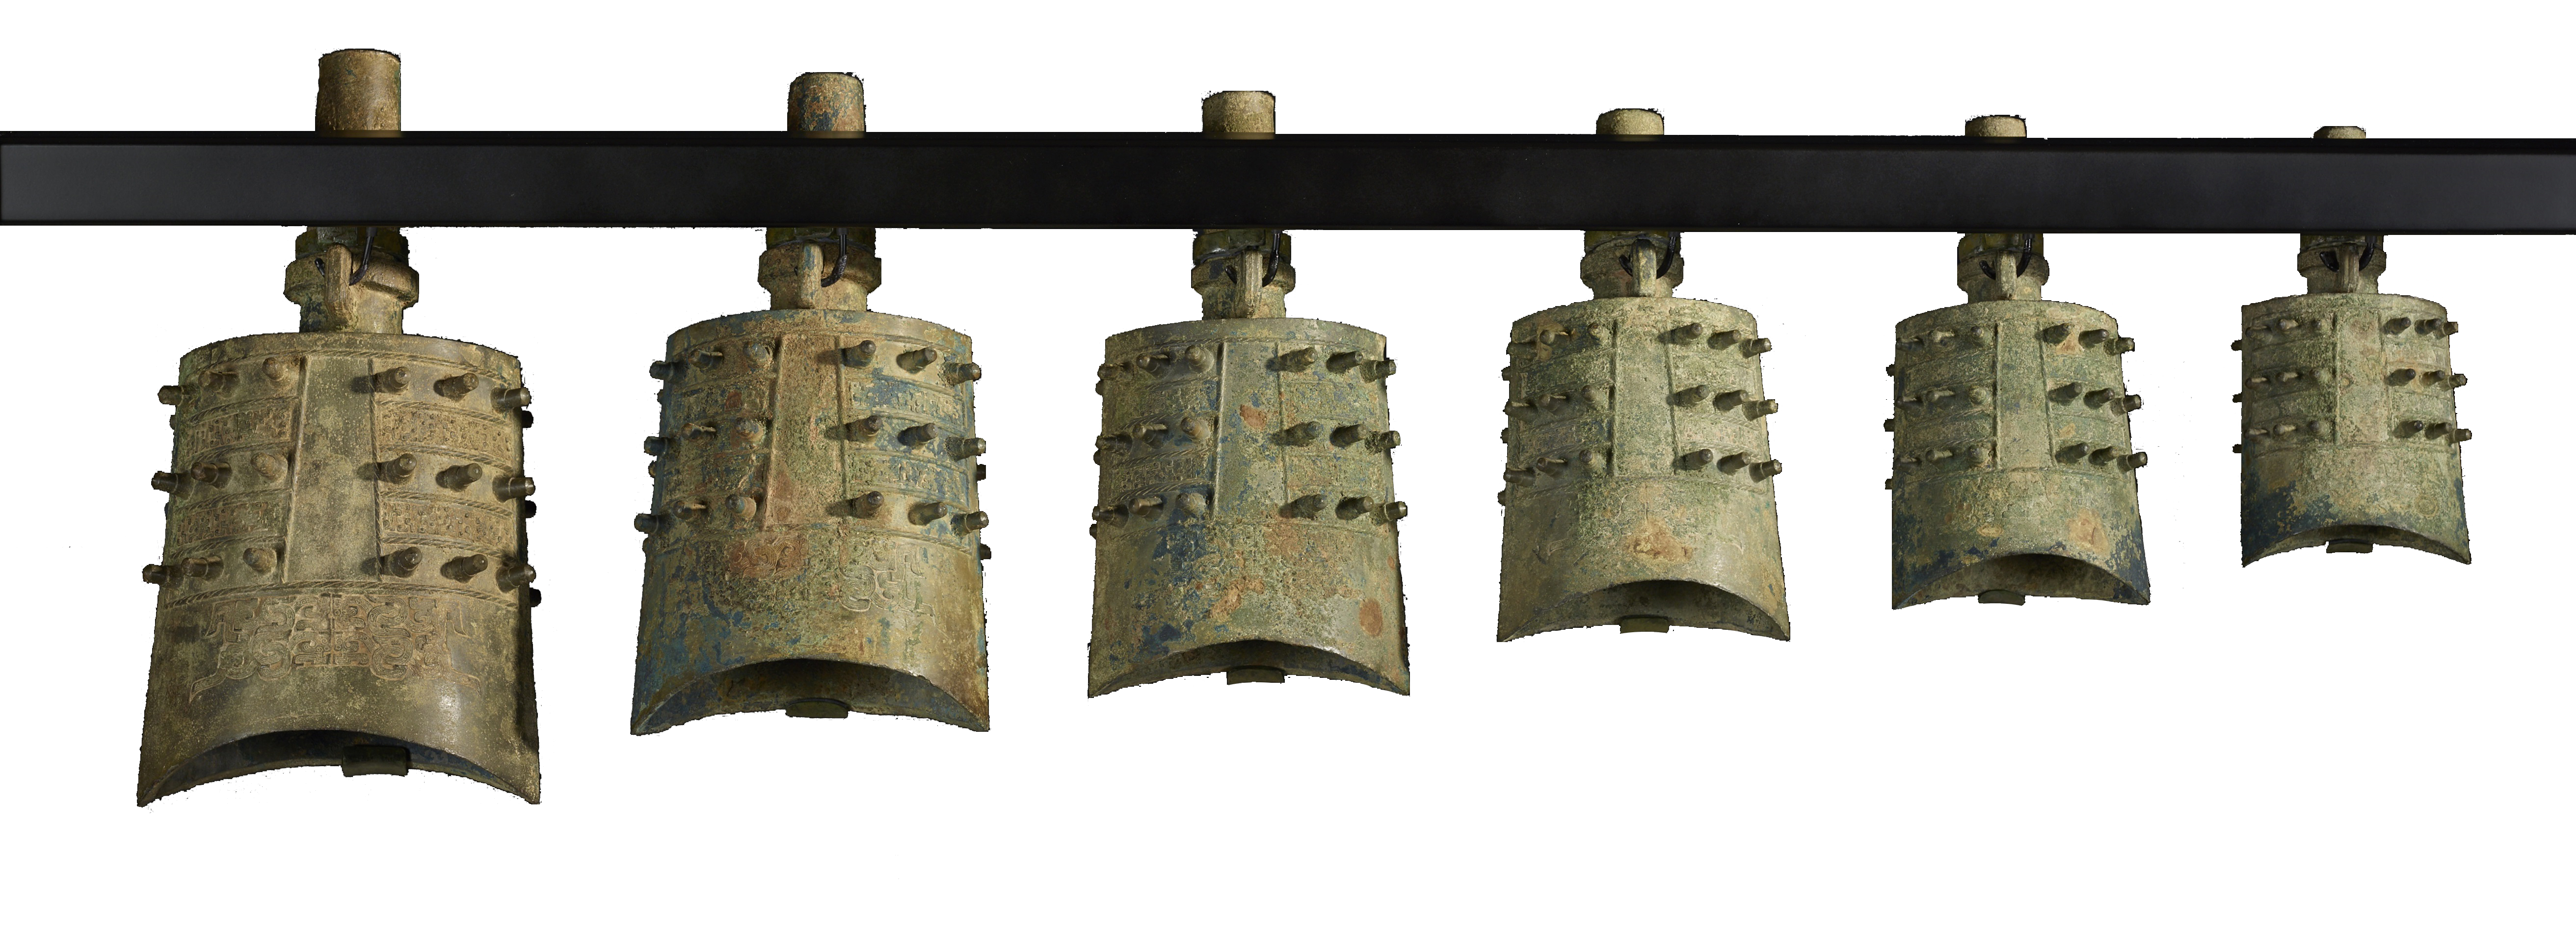
Tap the circles to hear the two tones of each bell. The keyboard shows the approximate pitches.
You can “see sound” with this bar graph. It shows the frequency, volume, and decay of the bell sound your ears are hearing.
You can “see sound” with this bar graph. It shows the frequency, volume, and decay of the bell sound your ears are hearing.